I like to generate state-spaces. I generate a lot of them. And I have made the code efficient enough that I can generate very large ones. Normally, when you code, using hundreds or even thousands of bytes for an object is no issue, but when you multiple 1000 with a million, you suddenly use 1 GB RAM, and when you multiple it by a hundred million, you run out of memory.
I recently made the largest state-space I (and most likely anybody in the world) have ever made for a coloured Petri net (CP-net or CPN), namely one with around 43 million states (before running out of memory). A state of CPN model is typically between 100 and 10000 bytes, and fitting 43 million of those in 10 GB memory took some medium-advanced algorithm engineering. A state of a CPN model is basically a tuple of (multi-)sets. In my case, I could reduce this to a 25-tuple, but just using a pointer for each entry (at the cost of 4 bytes per entry) and an object for each state (at the cost of 8 bytes), this would consume 43000000 * (25 * 4 + 8 ) = 4.6 GB, or almost half of the memory. I cannot represent a multi-set using only 4 bytes, so I need to do something more efficient.
To represent this, I basically share identical multi-sets and instead of using pointers, I enumerate all used multi-sets and use an index for each instead of a pointer. This allows me to use less memory, as an integer known to be less than 256 can be represented using only 1 byte, saving 3 bytes. 3 bytes does not sound like a lot, but multiplied by 25 entries, this becomes 75 bytes per state, and multiplied by 43 million states, this becomes 3.2 GB or almost three fourths of the total memory used before, bringing the total size for the information to around 25 bytes (+ 8 for storing this in an object). The actual data-structure is a bit more involved, as we cannot guarantee that the indices are less than 256, but using other tricks, the total is still around 25-30 bytes per state.
I need constant time lookup for each state, so I store them in a hash-table. In Java, this is extremely expensive. Excluding the objects we actually store, the price is 4 bytes for an entry in an array, the entry is an object (8 bytes) with a pointer (4 bytes) to the key (the actual state we are interested in), a pointer to a value (4 bytes) that we don’t care about, a cached hash value (4 bytes), and a pointer to a next entry in case of hash collisions (4 bytes). This is a total of 28 bytes of junk for each state, or just about as for the state itself.
For simplicity each state is represented as a byte array and an integer wrapped in an object. Aside from the 25-30 bytes payload, we have an overhead of 12 bytes (for the array) plus 8 bytes (for the object) and 4 bytes (for the extra integer, which is really only needed after the computation is done for diagnostics). Adding all of this, we use around 24 bytes (object overhead) plus 28 bytes (hash-table junk) plus 30 bytes (the actual data) or a total of 82 bytes or a total of around 3.5 GB. Java adds some other junk” which we will get back to later, and this sums up to 10 GB in total, meaning I could not analyze the entire state-space, which is apparently larger than 43 million states.
The first trick is to get rid of all the hash-table junk and all the object overhead. By not using the generic hash-table from Java, but instead using the GNU Trove collections. The basic idea is that instead of handling collisions by chaining entries, handling collisions by just putting the entry in another location. This library also allows the hash-function to be separate from the actual object, so we no longer need to wrap a state in an object, but can store the byte array directly in the hash table. This brings the overhead per state down to 4 bytes (for a pointer in an array) plus 12 bytes (for the byte array representing the state) or a total of 20 bytes compared to the previous 52 bytes. Not too shabby. Realistically, we’ll probably be using 4-8 bytes extra overhead as the array implementing the hash table has to be 2-3 times larger than the number of nodes stored in it to be efficient.
I also tried another implementation. It is possible to represent a set of bit-strings using a data-structure called a binary decision diagram, or BDD, which is basically an automaton accepting all bit-strings in the set. A BDD is constructed in a way which makes common set operations very fast and the data-structure compact when you magically give the input in the correct form. I tried the JavaBDD library, which is reasonably nice and provides interfaces to several common BDD libraries (such as BuDDY and CUDD) as well as its own Java-only implementation. Unfortunately, the BDD approach did not seem very promising, at least not during my initial experiments, but I’ll conduct some more experiments and conclude based on that later.
After using the GNU Trove collections, I was surprised I still used around 160 bytes per state, though my calculations said, I only needed around 50 bytes. I decided to do some memory-debugging – I have already written one piece on finding memory leaks in Java – but needed more advanced reports than provided by the built-in profiler. I have already tried the TPTP plug-in for Eclipse, which is free and in this case you certainly get what you pay for. It is ass-slow (because, apparently, asses are slow; well slower than horsies at least) except when it comes to crashing. It has refused to work on my computer for some months, so I decided to investigate other possibilities.
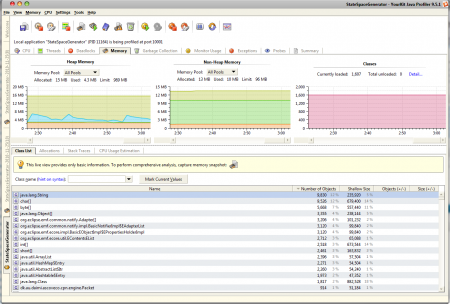
As we use the YourKit Java profiler for ProM, I decided to give that a try, and I must say I am impressed! It is fast and provides heaps of interesting information, some even in real-time. Attaching and running, I get a live view, like this:
This is showing an execution with a fixed version of the program as I don’t have any live views of executions with problems. It basically shows how the available memory is used and which classes take up the most memory. I only get approximate numbers and they include objects that are no longer used, but I get this information live and can follow how the computation progresses as well as compare the number of objects in memory with earlier points in time. All in all, very useful.
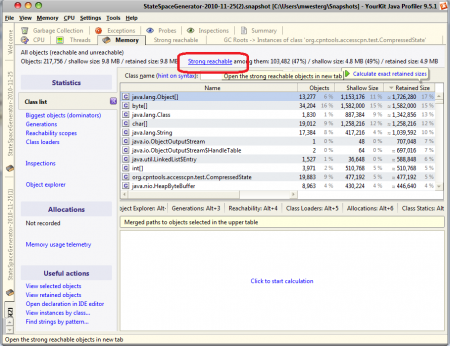
If I want more detail, I can make a snapshot of the memory, which provides me more information, but no longer live. A snapshot of the version of the program I had after making all my algorithmic improvements is here:
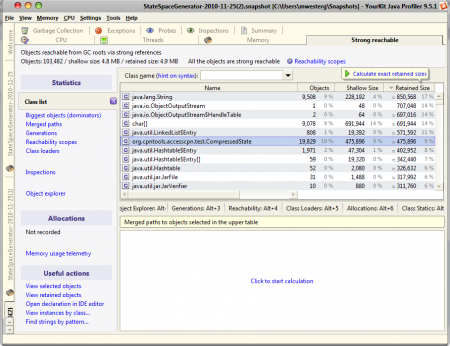
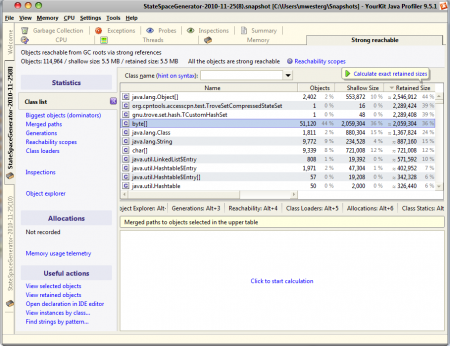
We see how much memory each class uses. This also include objects that should be garbage-collected, so let’s just show the strongly reachble object, or the objects which are really used:
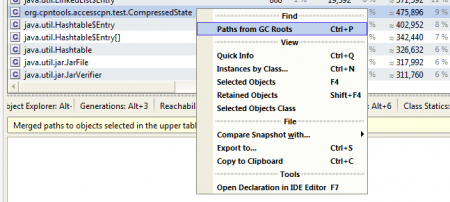
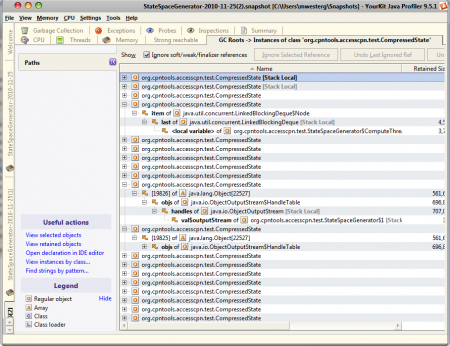
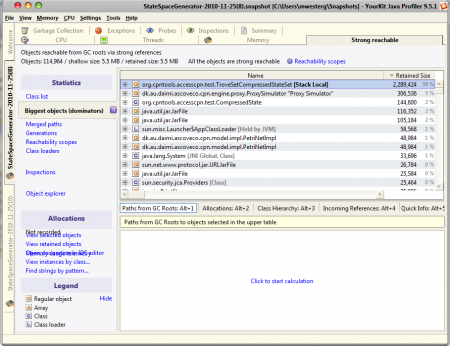
We see that we have almost 20000 instances of CompressedState for a total of 8 % of the total memory use. This makes no sense, as the point of using the Trove collections is exactly to get rid of these wrapper objects! Well, let’s figure out why these jackals are still alive. We select to see what keeps these objects alive:
And we get:
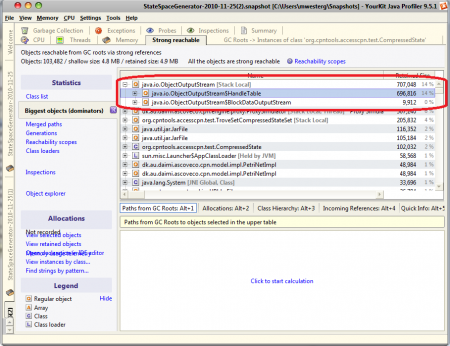
We have a long list of 20000 entries, and we expect around a couple hundred of these to be alive (well, I do because I know the details of the implementation). We can see that the first expanded object is good (again, I can because I know the code), whereas the other one is weird: An ObjectOutputStream keeps a reference to my objects? Ah, that’s true. I use such a stream to serialize data to disk for future processing and checkpointing. The ObjectOutputStream tries to write each object just once, so it keeps a map of objects to identifiers. Showing just the objects retaining the most memory also reveals this:
Well, this means that the stream maintains a duplicate of the data-structure I just got rid off! Screw you, inappropriately named stream! I switch from the regular writeObject method to the writeUnshared method, which promises not to do such tomfoolery. In the screen-shot we see that the stream uses 14% of the total memory while the actual state storage only uses around 4% of the total memory. The other “large” objects are start-up costs for running Java, and remain constant during computation with only the storage and stream growing.
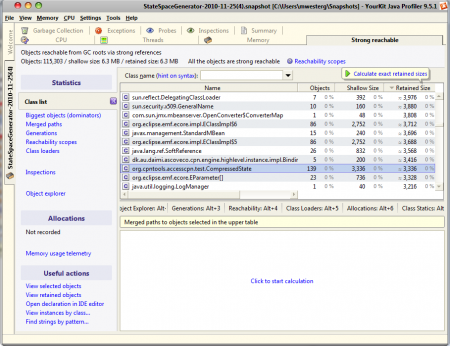
Fixing this and running the program again, we now get:
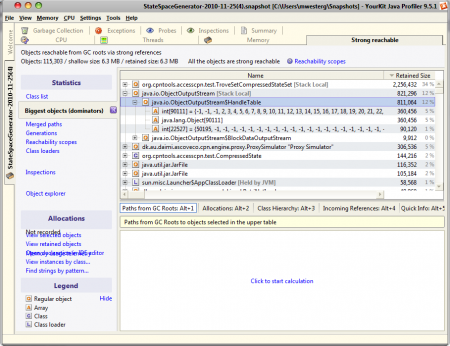
This is heaps better! We only have 139 instances (on a much longer run), so we have eliminated that annoyance. Let’s check out the biggest sinners:
Now that’s just a kick in the groin. Granted, we’ve reduced the size retained by the stream from being 3 times as large as the state set to being a third, but it still maintains some dumb-ass handle table. Ok, let’s get rid of ObjectOutputStream altogether and use the DataOutputStream, which doesn’t do such tomfoolery, and is adequate (but less elegant) for my purposes. Now, looking in the profiler again, I get:
Now the only big object is the state set, and that is just fine. The other “large” objects are meant to be this way. If we look at the distribution on classes, we get this observation further enforced:
The first four classes are all used to implement the state set and the remaining two-digit classes are used to implement Java’s class-loader mechanism, and does not grow during execution. Nice.
Now we have a fairly efficient data-structure, allowing me to store as many as 318500 states using just 32 MB memory (for the total algorithm, not just for the state set), or around 105 bytes per state, which, including overhead and auxiliary data-structures isn’t too bad. I’m currently investigating how it fares for larger amounts of memory, making the overhead less dominant. I’ll also be doing some longer-running profiling to see if any data-structures other than the state set grows during execution. The profiler conveniently offers grabbing a memory snapshot periodically, so I can just start this and do other stuff in the meantime. Such as writing this.
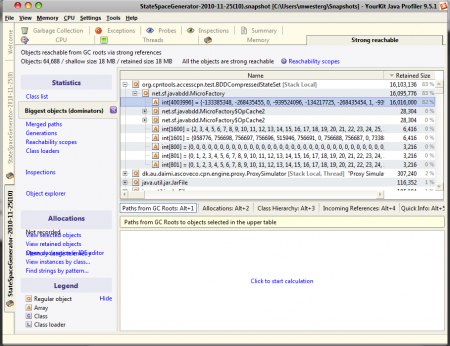
For kicks and giggles, I also decided to see how the other implementations of the state set fared. First, the one using BDDs:
Here, we also use “all” memory for the state set, showing that we are not wasting other objects anywhere. We use a lot of memory for an integer array, which basically stores nodes of the BDD. This is natural and expected. The size of the BDD does not grow linearly in the number of nodes represented, so only long-running experiments can reveal if this is better than the packed hash table.
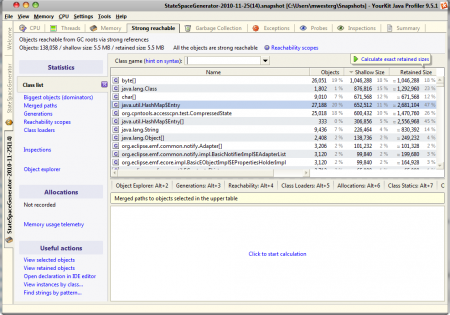
The generic hash-table version profiling shot clearly shows what I also gathered by analysis and counting:
The hash map entry and the object encapsulation (CompressedState) use more memory than the actual states (byte[]), so getting rid of them was a good idea.
So, to conclude: memory efficiency in Java is a matter of clever algorithmics (choosing an appropriate representation and some times working around the nice object oriented paradigm; you may be interested in the flyweight design pattern to make this more bearable) and memory profiling. I did most in the first category because I did not have access to a decent profiler, but as we see on the profiling charts, much of what I theorized could have been observed by looking at the profiling chart. the profiler will also tell you where to focus your effort. Some times, the profiler will also allow you to find problems, you would be hard pressed to find on your own (I may have been able to find that ObjectOutputStream stored a copy of each CompressedState given enough time as I know how it works, but I doubt I’d have caught that it still stored “some crap” and wasted 25% memory without the profiler). Furthermore, a good profiler helps you figure out where to focus your algorithmic effort.
Well, I’m off to analyze some more profiling logs.

2 thoughts on “Memory-Efficiency in Java”