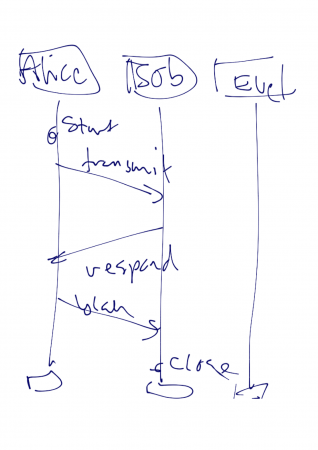
While colored Petri nets are graphical, they are also quite complex to explain to non-experts. This has previously been addressed by domain-specific visualizations (see also Mimic/CPN and the BRITNeY Suite). One particularly useful visualization is message sequence charts. This visualization is so useful, it has previously been implemented for Design/CPN, the predecessor of CPN Tools, […]
Tag: Message-sequence charts
ProM Plug-in Suggestion: Social Network MSC Visualization
Posted on by Michael

I think it would be neat to view a trace as a message sequence chart with the processes being resources and messages events. Mockup: Aside from being useful in and of itself, it could also be used with the KeyValue plug-in to generate MSCs of CPN model executions. Which would be neat. A further perspective […]
Read More… from ProM Plug-in Suggestion: Social Network MSC Visualization