If you don’t find mathematical tuples XML/JSON/YAML/HTML a list of tasks with start/end dates graphical, I don’t know what to tell ya… Yet, people wil incessantly try and get me to update their Excels or (worse) ask me for one whenever I run a project. I dislike double representation because it is worse than double work: it’s double work just to make two representations and then extra work to try and keep the two moderately N-SYNC until after a couple of weeks the Excel-lovers finally give up.
It’s a real problem.
The real problem with planning and keeping track of time is not the tooling, it is that people are bad at and hate to plan and keep track of time. Thus, any tooling will suck. The goal should never be to make better tools to make keeping track of time and planning easier, but to make tools to reduce how much planning and time tracking is needed. Synchronising data between tools is not a means to this end.
Thus, I present the magnificent “I Я Project Manager,” a tool to present tickets from Gitlab graphically so hopefully people will refrain from sending me Excels (or Sharepoints with Excels). Note: the “я” in the name is not a mirrored “R” abbreviating “are” to insinuate project managers are little children who cannot properly conjugate or spell verbs, it is the Cyrillic letter “ya,” which in Russian means “I” or “I am.” Thus, the name insinuates project managers use language they don’t understand almost (but not entirely) correctly to try and seem smarter, eventually just leading to confusion for all. That, or I came up with the explanation after the name. Anyhow…
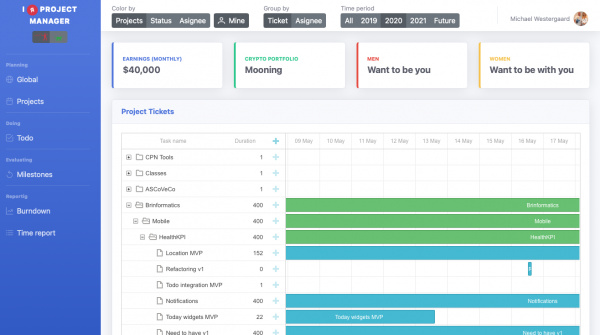
The entire goal of “I Я Project Manager” is to extract ticket information and display it as a gantt chart to provide overview of progress, planning, resource load etc. Here’s a screen from the current version connected to my own Gitlab instance:

This is generated from historical data not intended for such usage and should reflect common usage. If no proper start/end/estimates exist for tasks, they are inferred from available information (like ticket activity).
The meat is the gantt overview. It can work in two planning modes: global planning and project(s) planning. Global planning is intended for resource planning and the like and works on milestone level. Projects planning only shows a small set of projects but works on the ticket level. This allows monitoring progress, and doing time/resource forecasts.
Milestones and tickets can be moved/added/removed and changes will be reflected in the underlying tickets. Thus, this should make it possible to set up milestones/sprints well in advance, and not just in some dumb Excel the most junior developer then gets tasked with duplicating in the ticketing system afterwards, but as real artefacts in the underlying ticketing system. It is also possible to do sprint planning by putting tickets into the appropriate milestones.
Tasks can be coloured by project (in the global planning view), status and assignee to focus on the desired aspects. Tasks can be grouped by ticket or assignee to plan (and review) based on projects or individuals. Finally, tasks can be filtered to only focus on this year, last year, next year, only incomplete milestones/tickets or all tickets.
During development, I realised the tool can also be useful for developers, so I added a mode with less focus on global planning and more support for focusing on the individual:
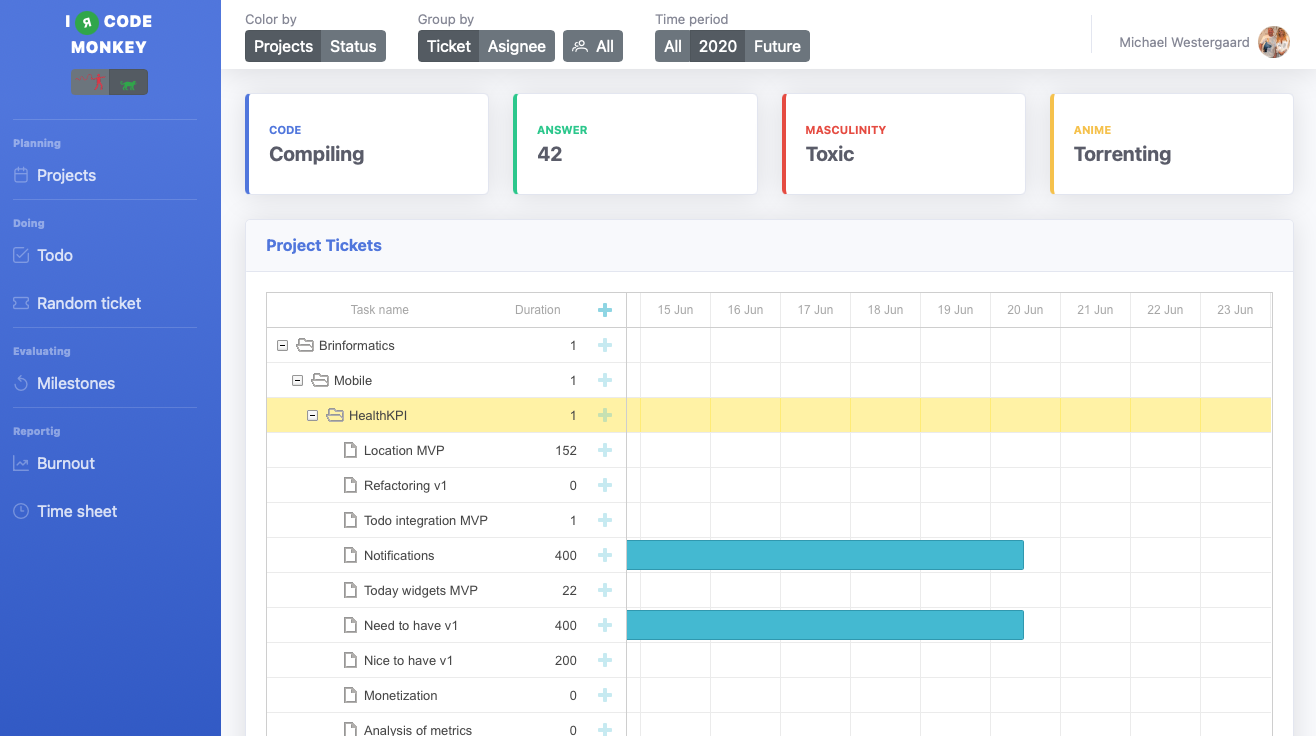
Here, colouring and filtering have been reduced, the ability to colour only the logged in user’s tickets has been replaced by the ability to instead filter out other users’ tickets altogether.
The goal is not to limit users, as the application is only able to do exactly what the user can do directly from the Gitlab UI, but just to hide irrelevant information. As such, it is possible to switch between the two modes using a simple switch in the menu.
In addition to use for planning, the tool also assists in execution of projects, subsequent evaluation (what was the quality of estimates, etc.), and for providing live reporting. These functionalities are not fleshed out yet, but the intent is that it should be possible and easy for developers to see a list of assigned tasks and what is next in their planning (and which tasks wait for PM actions), to learn from past projects, and to get live progress information including time sheets for entering into (or sending to somebody for them to enter into) ghastly time reporting system is being applied.
The application is written in Angular/Typescript using Bootstrap for styling and Spring Webflux/Java for the backend. I’ll probably throw up a version at some point when I’ve got the planning aspects to a usable place (maybe including source, who knows).
Let me know if you think this is useful and which features you’d want to see in an application like this.